Available now — open to roles & projects

I turn complex data into decisions that move business forward.

Senior Business Analyst & BI Specialist with 20+ years in operations and 5+ years in energy & EV infrastructure. I build analytical systems that scale — across countries, teams, and boardrooms.

10
EU countries, one model
890+
EV sites analysed
20+
years in ops & data
100%
on-time delivery

The person between the data and the decision.

I specialise in turning ambiguous business problems into scalable analytical systems — the kind that survive a CFO question at 8 AM on a Monday.

I've managed multi-country stakeholder environments (8+ countries simultaneously), built BI systems from scratch on Azure and Databricks, and presented investment analysis at board level. I speak fluent business and fluent data.

Based remotely in Italy. Currently available for project-based, fractional, and permanent engagements across Europe.

AgilePM® Practitioner Microsoft PL-300 Power BI Claude & AI Mastermind INTL Make — AI Automations & Agents Power BI DAX & Power Query Databricks (Azure) SQL · MySQL · SQL Server Python Claude Code Tableau ETL Pipeline Design Sitetracker · Business Central SharePoint · Power Automate Stakeholder Management Multi-country Programmes Board-level Reporting

Case Studies

Real problems. Real solutions. Results you can take to a board meeting.

AI-Assisted Development Claude Code Python Pipeline

The Chaos Inbox — from 6 hours of Friday admin to seconds

Client: Bottega Nord S.r.l. (synthetic demo)  ·  Role: AI-Directed Developer

Demo case study built on fully synthetic data. "Bottega Nord S.r.l." is a fictional client — every document was generated for the demo. The pipeline, and the problems it solves, are entirely real.

Bottega Nord, a specialty food distributor in Lombardy, receives ~800 supplier order confirmations a month — PDF invoices in three different layouts, Excel exports that never match, semicolon CSVs with Italian decimal commas, and orders typed straight into emails. Every Friday, ~6 hours disappeared into manual reconciliation. Duplicate invoices still got paid. Price increases still went unnoticed.

The Pain

  • ~800 supplier confirmations/month across 4 incompatible formats
  • ~6 hours of manual reconciliation every Friday
  • Duplicate invoices still slipped through and got paid
  • Silent price increases went unnoticed

The Build

  • Five-stage Python pipeline, built with AI-assisted development (Claude Code)
  • Ingestion → extraction → normalization → anomaly detection → reporting
  • One command, no manual steps
  • Fuzzy-matches supplier & product names against a reference catalog
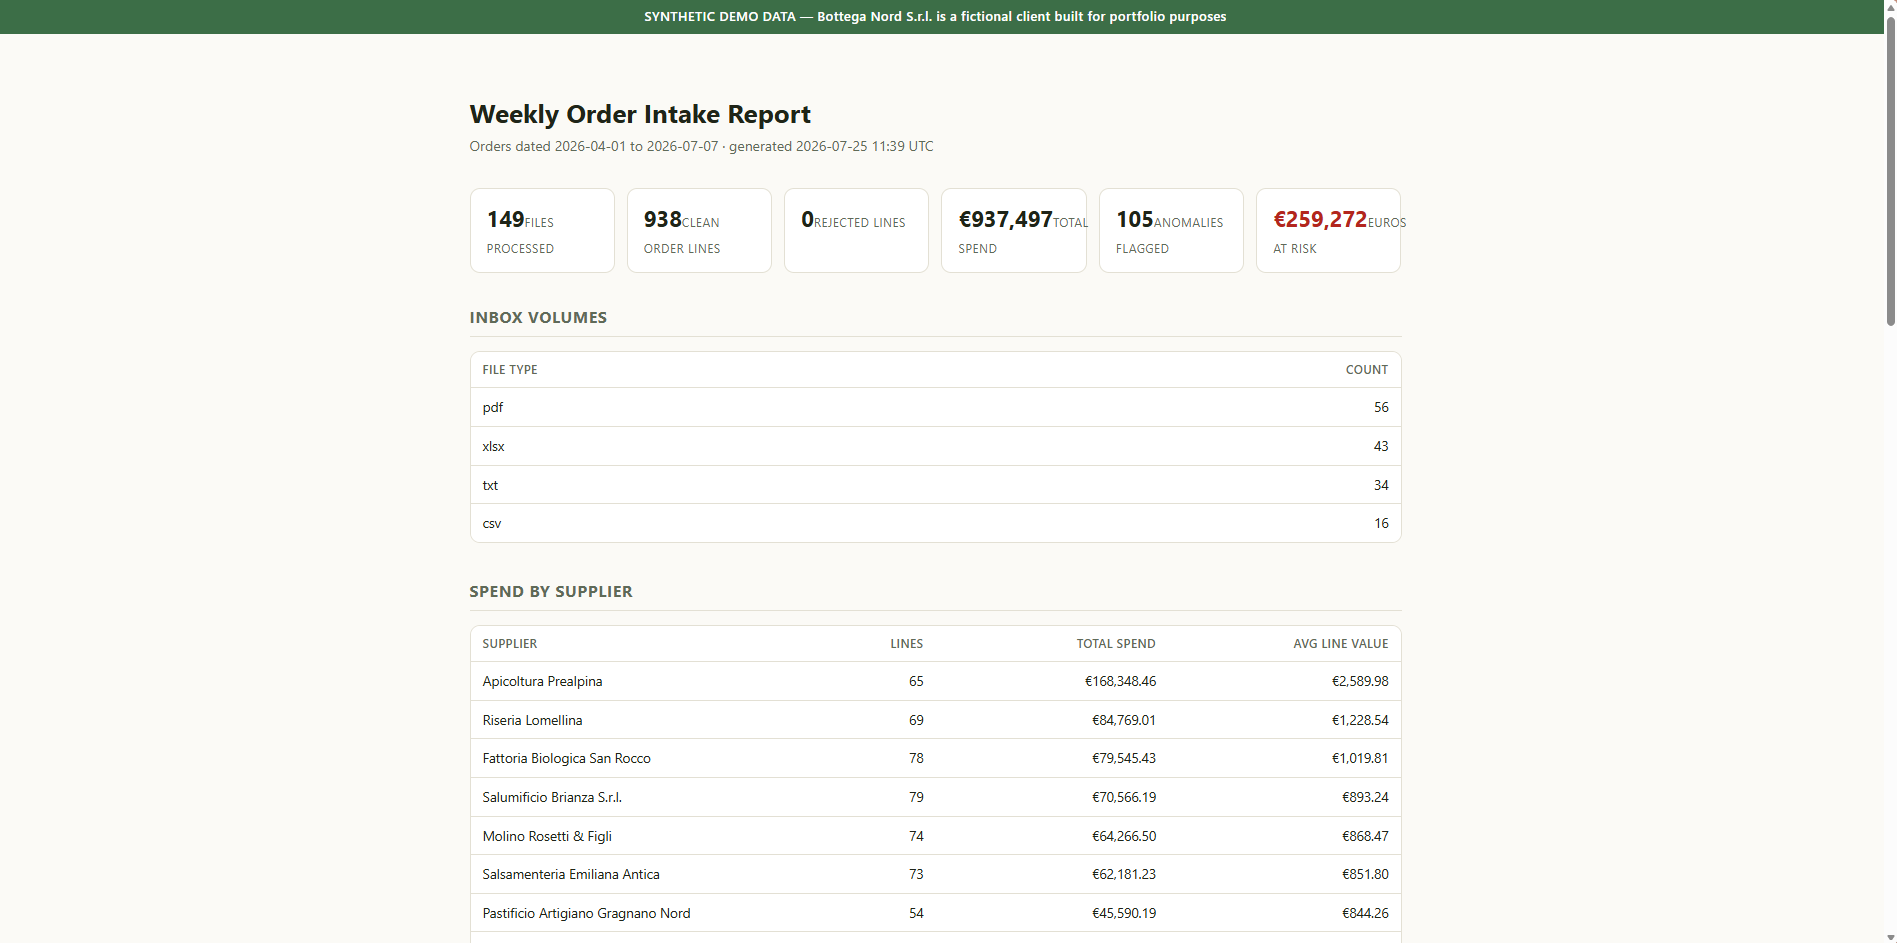
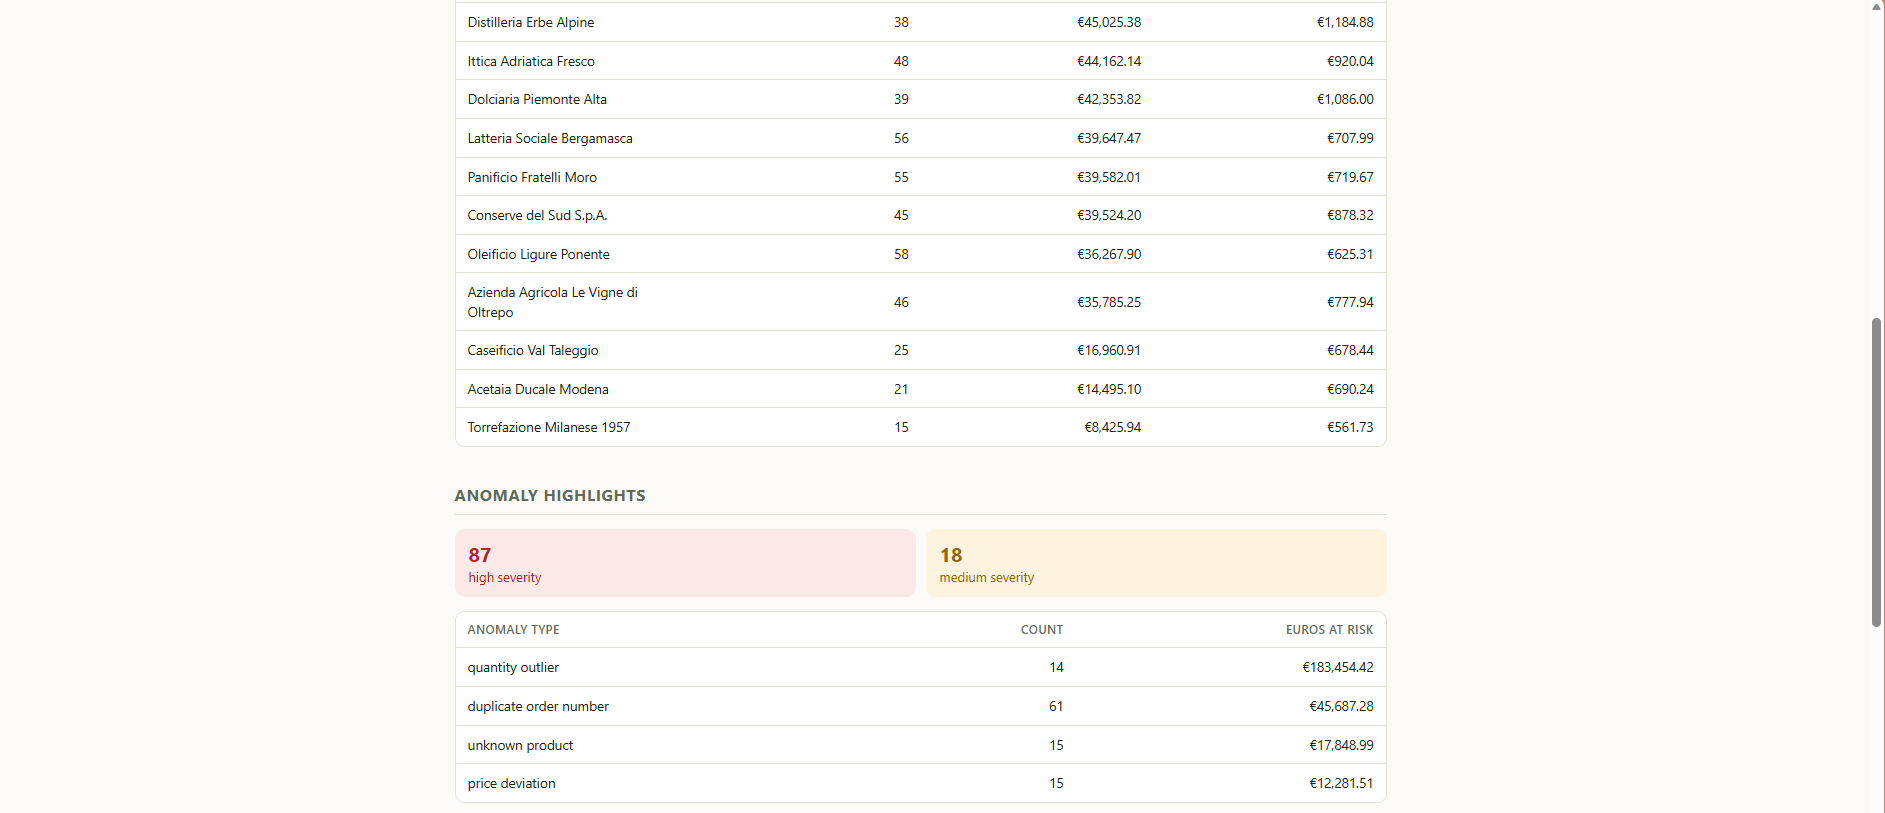
Chaos Inbox weekly report — KPI summary Chaos Inbox weekly report — anomaly highlights

The Numbers

149 → 938
Documents in · clean order lines out
Seconds
Not hours — full pipeline runtime
105
Problems caught automatically
€259,272
Flagged at risk · biggest single catch: a €90,941 mis-keyed order (793 units instead of ~27)

The Kicker

The data is synthetic. The pipeline isn't. If your team runs on supplier paperwork, spreadsheets nobody trusts, or an inbox that eats a day a week — this same architecture drops onto your data. Let's talk →

Python pandas pdfplumber rapidfuzz Claude Code GitHub ↗
BI Architecture Data Modelling Multi-country

10-Country EV Utilisation Model

Client: Major European EV Infrastructure Operator  ·  Role: BI Analyst & Data Architect

An inherited Excel model covering 10 EU markets had become unmaintainable — riddled with hardcoded values, broken as soon as a country changed a rate or assumption, and impossible to audit. Finance, Operations, and Country Leads were all working from different versions of the truth. The business needed a single, governed source of analytical truth that could answer utilisation and revenue questions across an entire European network — in real time.

The Problem

  • 10-country model with hundreds of hardcoded formula cells
  • No single version of truth — teams used conflicting spreadsheets
  • Manual refresh cycle: hours of work per market update
  • No auditability or change tracking — high risk in regulated environment

What I Built

  • Full star-schema data model on Azure Databricks
  • Zero hardcoded formulas — all assumptions governed as parameters
  • Power BI front-end delivering live cross-country views
  • Automated ETL pipelines replacing manual data collection

Outcomes & Impact

10
EU markets served from one governed model
0
Hardcoded formulas in the rebuilt system
Real-time
Dashboard refresh replacing days of manual work
One truth
Finance, Ops & Country Leads aligned on same data

Approach

  • Discovery: mapped all 10 country models to identify shared vs. market-specific logic
  • Architecture: designed star-schema (fact + dimension tables) to handle multi-country complexity cleanly
  • Build: developed on Azure Databricks with parameterised assumption tables instead of hardcoded cells
  • Reporting layer: Power BI dashboards with cross-country and drill-down views
  • Governance: version control, documentation, and stakeholder training across 4+ country teams
Azure Databricks Power BI DAX & Power Query Star-Schema Modelling ETL Pipelines SQL 10 EU Markets Stakeholder Management
Power BI Board Reporting Finance & Ops

Finance & Ops Dashboards + Board-Level Investment Analysis

Client: SWARCO Smart Charging  ·  Role: BI & Analytics Specialist

SWARCO's Finance and Operations leadership needed visibility they couldn't get from their existing reports — scattered across systems, too slow to generate, and not designed for decision-making. On top of that, strategic investment decisions on EV charging infrastructure required a rigorous analytical framework that could survive board-level scrutiny. I was brought in to build both: the operational reporting layer and the investment analysis that went to the board.

The Problem

  • Finance & Ops reporting fragmented across multiple source systems
  • No self-service BI — leadership dependent on manual data pulls
  • Investment decisions made without a structured analytical framework
  • Board needed a clear, defensible view of infrastructure ROI

What I Built

  • Power BI dashboards for Finance leadership — P&L, cost tracking, KPIs
  • Operations dashboard — utilisation, deployment status, performance trends
  • Investment analysis model evaluating EV infrastructure opportunities
  • Board-ready outputs: scenario modelling, risk view, recommendation layer

Outcomes & Impact

Self-service
Leadership could answer their own data questions — no analyst dependency
Board
Investment analysis presented at board level and approved
Finance + Ops
Two functions aligned on one reporting layer for the first time
Defensible
Scenario & risk modelling held up under board-level challenge

Approach

  • Stakeholder discovery: workshops with Finance and Ops leads to map reporting needs and decision workflows
  • Data architecture: connected disparate source systems into a clean Power BI data model
  • Dashboard design: built for decision-making — not just data display. KPIs surfaced at the top, drill-through for detail
  • Investment model: structured ROI framework with scenario sensitivity analysis and risk flags
  • Board delivery: translated analytical findings into clear executive narrative with recommendation layer
Power BI DAX Power Query Financial Modelling Investment Analysis Scenario Modelling Board Reporting Stakeholder Engagement
Competitor Intelligence Strategy

10-Country CI System

Major European EV Infrastructure Operator
Built a structured competitor intelligence framework covering 10 EU markets — monitoring charging network growth, pricing strategies, and site expansion patterns. Enabled country teams and senior leadership to track competitive dynamics for the first time with a consistent, repeatable methodology.

Competitor Analysis Data Frameworks Power BI 10 EU Markets Strategic Reporting
Geospatial Analytics Site Evaluation

EV Site Profitability Model

E.ON Drive Infrastructure — Italy
Built a geospatial analytics framework to evaluate 890+ potential EV charging sites across Italy. The model scored sites on commercial viability, traffic, competition, and infrastructure factors — giving the business a defensible, data-driven methodology for site selection and investment prioritisation.

Geospatial Analysis Site Scoring Model Power BI 890+ Sites Investment Prioritisation

What I bring to a project

Technical depth. Business fluency. End-to-end delivery.

📊

BI & Dashboard Design

Power BI, Tableau, DAX and Power Query. I build dashboards for decision-makers, not data engineers — clear, fast, and built to last.

🏗️

Data Modelling & Architecture

Star-schema design, ETL pipelines, Azure Databricks. Systems that scale without needing constant maintenance or a team of engineers.

🔍

Business & Competitor Analysis

Frameworks for site profitability, market entry, and competitive intelligence. Turn raw data into strategic recommendations.

📈

Financial & Investment Analysis

ROI models, scenario analysis, and board-ready outputs. I translate numbers into the language of investment decisions.

🌍

Multi-country Programme Management

Managed 8+ countries simultaneously. AgilePM Practitioner. 100% on-time delivery track record across 50+ EV deployment projects.

🤝

Stakeholder & Exec Communication

Bridge builder between technical teams and business leadership. I present to boards and I can explain data to anyone.

Services

Project-based engagements designed to deliver fast, tangible outcomes.

BA Sprint
Fixed scope · 2–4 weeks

Rapid Business Analysis

Stuck on a business question you can't quite answer with your current data? I come in, map the problem, analyse what you have, and deliver a structured brief with findings and recommendations. Fast, focused, actionable.

Great for: Startups & scale-ups
Power BI Build
Fixed or time-bound · 3–6 weeks

BI Dashboard & Reporting

From messy data sources to clean, decision-ready dashboards your whole team can use. Includes data model design, dashboard build, and a handover session so you're not dependent on me to keep the lights on.

Great for: Finance, Ops, Exec teams
Automation Setup
Fixed scope · ~1 week

Workflow Automation

The repetitive work that eats your team's week — automated, tested, and documented. I connect your tools (CRM ↔ spreadsheets ↔ reporting) so they talk to each other, with AI handling the judgement calls. Built in Make — extending into custom Python pipelines when no-code hits its limits.

Great for: Lean teams & founders
AI-Assisted Dev
Scoped per project · days, not months

Custom Tools, Built with AI

Some problems are too custom for no-code and too small for a dev agency. I direct AI (Claude Code) to build working tools for your business — document-processing pipelines, internal apps, data cleaners. You bring the messy process; I ship the tool that eats it.

Great for: Custom internal tools
Fractional BI Lead
Ongoing · 1–3 days/week

Embedded Analytics Partner

For growing companies that need senior BI capability without the overhead of a full-time hire. I join your team part-time, own the analytics function, and help you build data habits that scale.

Great for: Series A/B energy & tech

Let's solve something together.

Available now for remote projects and roles across Europe. If you have a data problem, a BI gap, or a business question that needs answering — let's talk.