Available now — open to roles & projects

I turn complex data into decisions that move business forward.

Senior Business Analyst & BI Specialist with 20+ years in operations and 6+ years in energy & EV infrastructure. I build analytical systems that scale — across countries, teams, and boardrooms.

10
EU countries, one model
890+
EV sites analysed
20+
years in ops & data
100%
on-time delivery

The person between the data and the decision.

I specialise in turning ambiguous business problems into scalable analytical systems — the kind that survive a CFO question at 8 AM on a Monday.

I've managed multi-country stakeholder environments (8+ countries simultaneously), built BI systems from scratch on Azure and Databricks, and presented investment analysis at board level. I speak fluent business and fluent data.

Based remotely in Italy. Currently available for project-based, fractional, and permanent engagements across Europe.

AgilePM® Practitioner Microsoft PL-300 Power BI Claude & AI Mastermind INTL Make — AI Automations & Agents Power BI DAX & Power Query Databricks (Azure) SQL · MySQL · SQL Server Python Claude Code Tableau ETL Pipeline Design Sitetracker · Business Central SharePoint · Power Automate Stakeholder Management Multi-country Programmes Board-level Reporting

Case Studies

Real problems. Real solutions. Results you can take to a board meeting.

Business Analysis BPMN 2.0 & UML Enterprise Architect

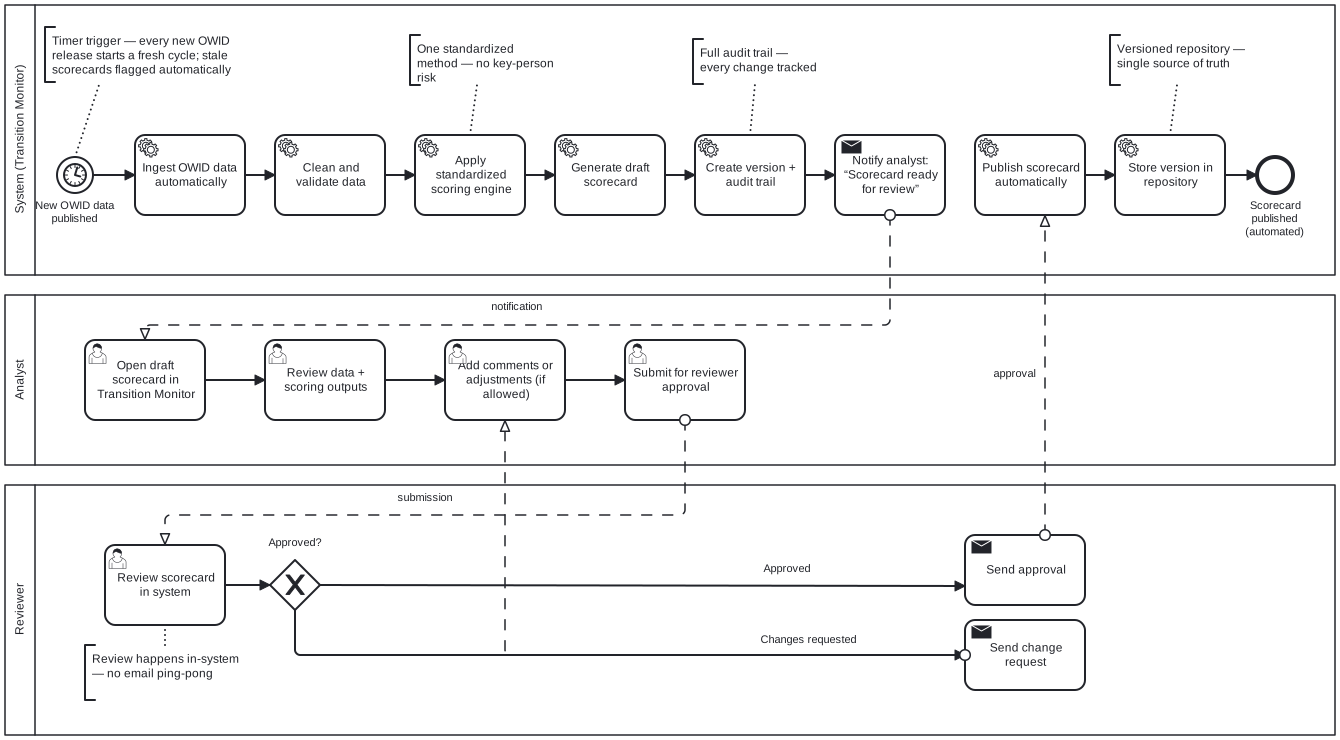
Transition Monitor — a 15-day manual scorecard, redesigned as a governed process

A country scorecard that took 15 working days, used a method living in one analyst's head, and silently went stale whenever the data updated. I mapped the AS-IS honestly, designed the TO-BE around a human review gate, modelled the data so every published number is traceable, and wrote the wireframes with their requirement IDs on the page.

Read the full case study →
AI-Assisted Development Claude Code Python Pipeline

The Chaos Inbox — from 6 hours of Friday admin to seconds

Client: Bottega Nord S.r.l. (synthetic demo)  ·  Role: AI-Directed Developer

Demo case study built on fully synthetic data. "Bottega Nord S.r.l." is a fictional client — every document was generated for the demo. The pipeline, and the problems it solves, are entirely real.

Bottega Nord, a specialty food distributor in Lombardy, receives ~800 supplier order confirmations a month — PDF invoices in three different layouts, Excel exports that never match, semicolon CSVs with Italian decimal commas, and orders typed straight into emails. Every Friday, ~6 hours disappeared into manual reconciliation. Duplicate invoices still got paid. Price increases still went unnoticed.

The Pain

  • ~800 supplier confirmations/month across 4 incompatible formats
  • ~6 hours of manual reconciliation every Friday
  • Duplicate invoices still slipped through and got paid
  • Silent price increases went unnoticed

The Build

  • Five-stage Python pipeline, built with AI-assisted development (Claude Code)
  • Ingestion → extraction → normalization → anomaly detection → reporting
  • One command, no manual steps
  • Fuzzy-matches supplier & product names against a reference catalog
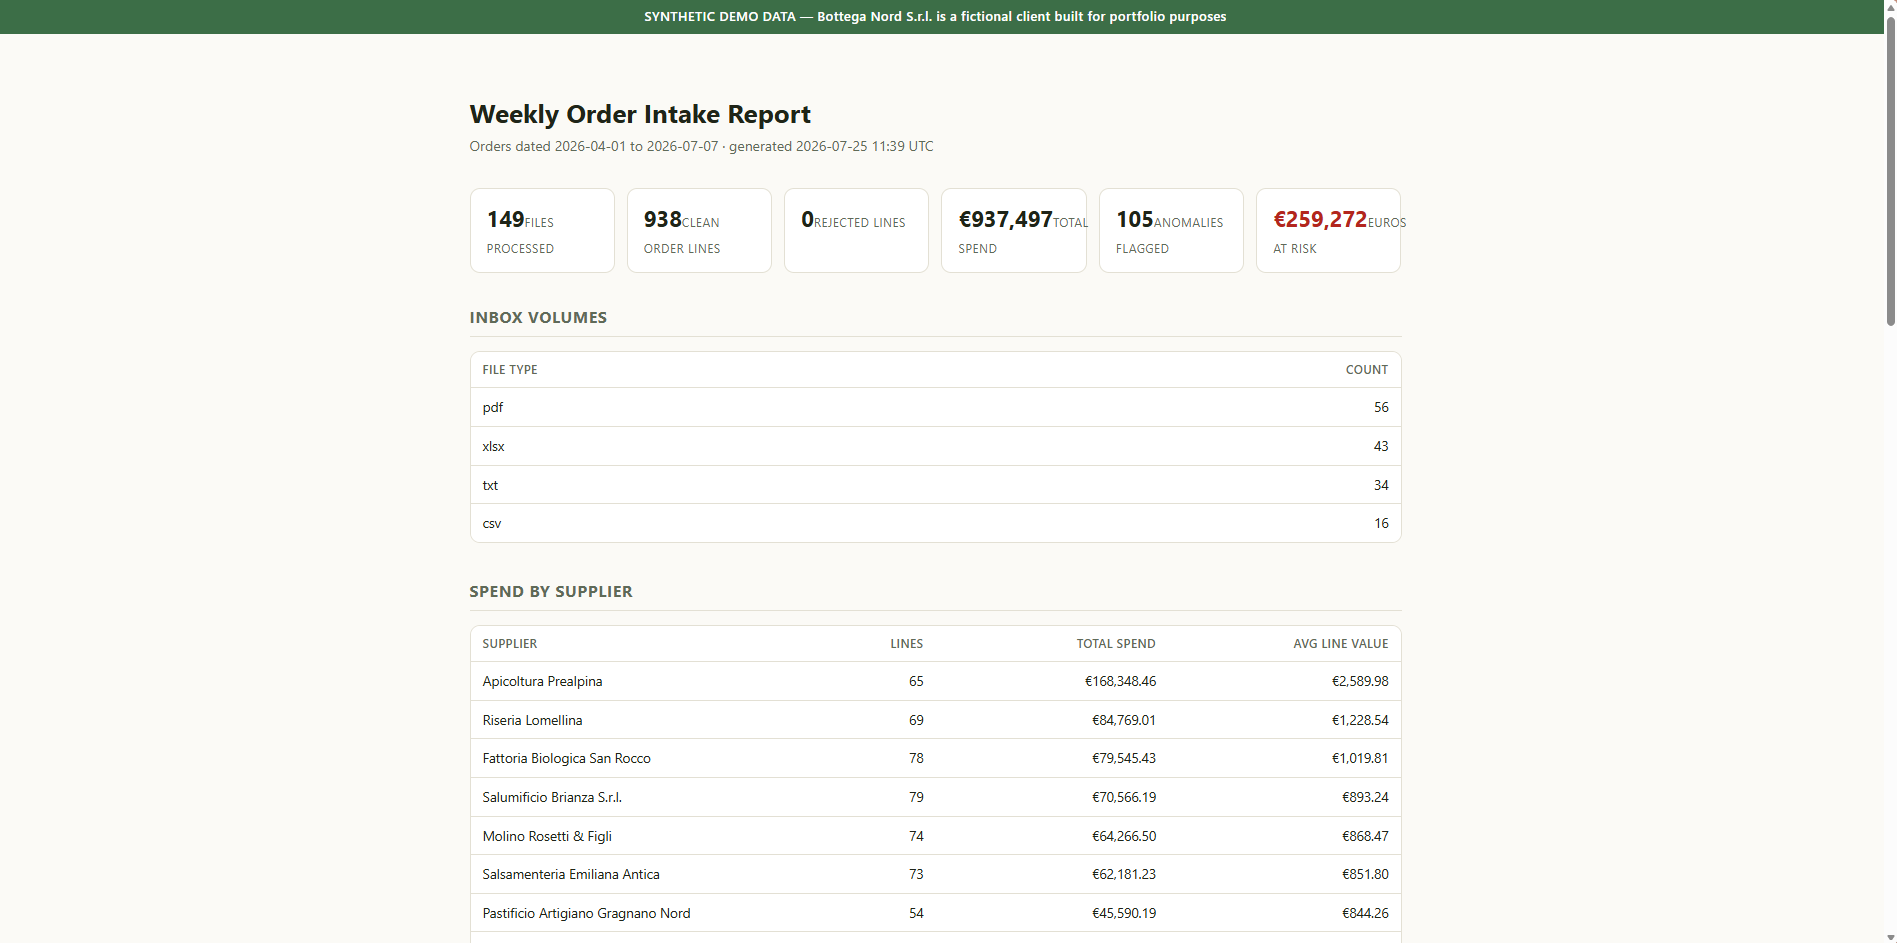
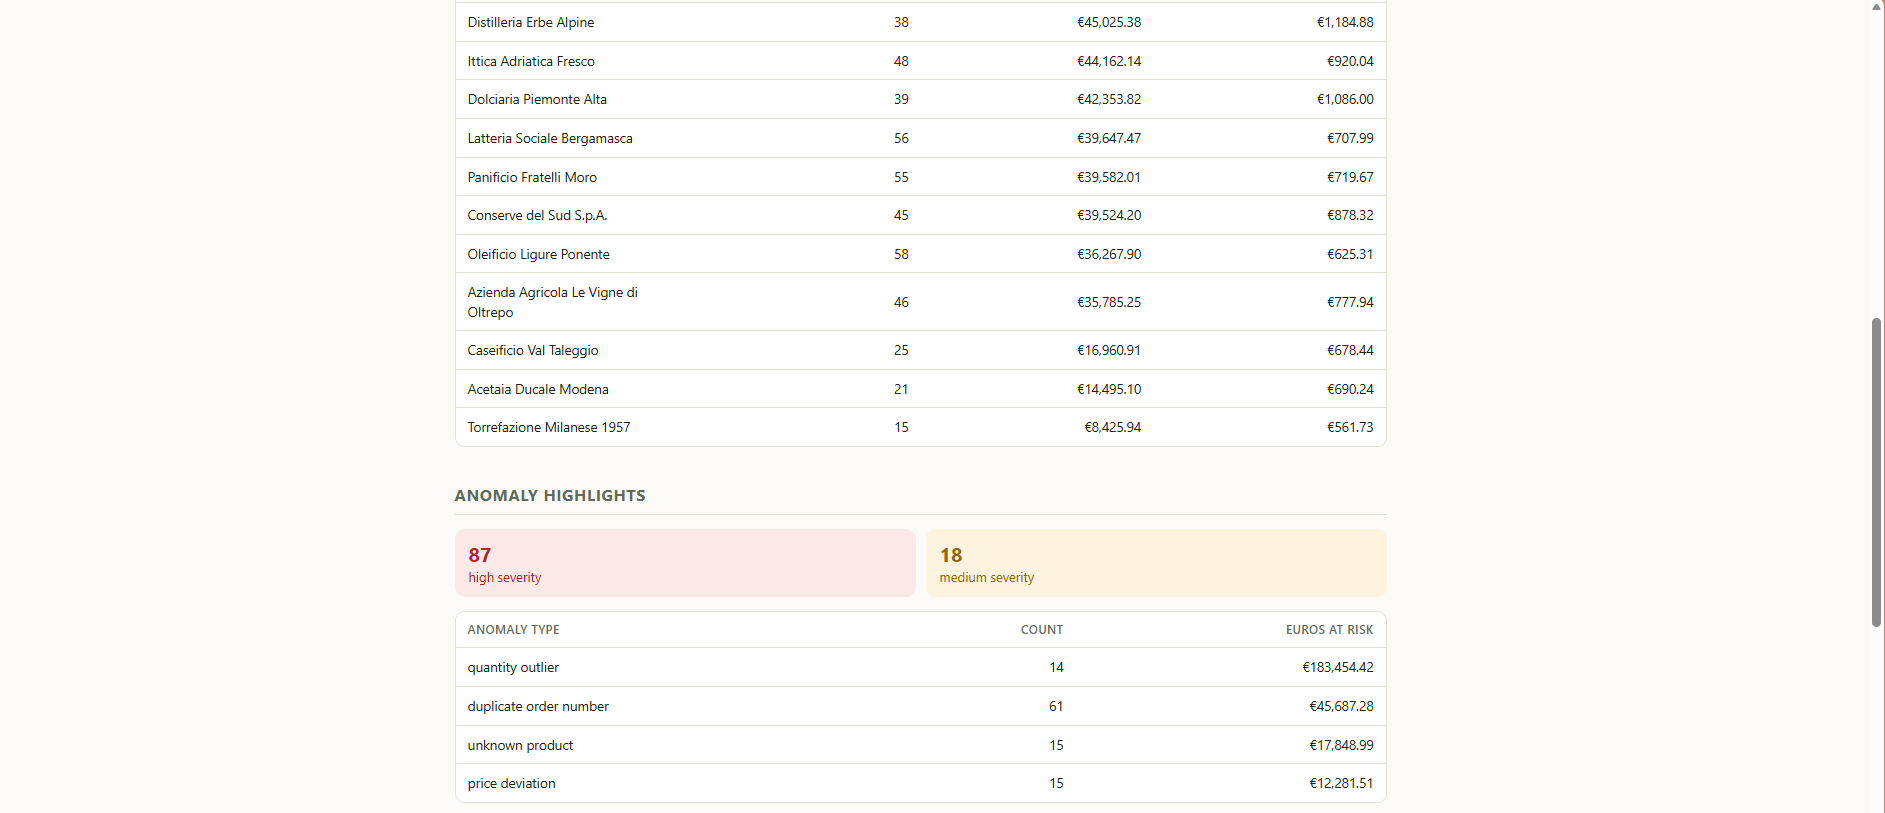
Chaos Inbox weekly report — KPI summary Chaos Inbox weekly report — anomaly highlights

The Numbers

149 → 938
Documents in · clean order lines out
Seconds
Not hours — full pipeline runtime
105
Problems caught automatically
€259,272
Flagged at risk · biggest single catch: a €90,941 mis-keyed order (793 units instead of ~27)

The Kicker

The data is synthetic. The pipeline isn't. If your team runs on supplier paperwork, spreadsheets nobody trusts, or an inbox that eats a day a week — this same architecture drops onto your data. Let's talk →

Python pandas pdfplumber rapidfuzz Claude Code GitHub ↗
BI Architecture Data Modelling Multi-country

10-Country EV Utilisation Model

Client: Major European EV Infrastructure Operator  ·  Role: BI Analyst & Data Architect

An inherited Excel model covering 10 EU markets had become unmaintainable — riddled with hardcoded values, broken as soon as a country changed a rate or assumption, and impossible to audit. Finance, Operations, and Country Leads were all working from different versions of the truth. The business needed a single, governed source of analytical truth that could answer utilisation and revenue questions across an entire European network — in real time.

The Problem

  • 10-country model with hundreds of hardcoded formula cells
  • No single version of truth — teams used conflicting spreadsheets
  • Manual refresh cycle: hours of work per market update
  • No auditability or change tracking — high risk in regulated environment

What I Built

  • Full star-schema data model on Azure Databricks
  • Zero hardcoded formulas — all assumptions governed as parameters
  • Power BI front-end delivering live cross-country views
  • Automated ETL pipelines replacing manual data collection

Outcomes & Impact

10
EU markets served from one governed model
0
Hardcoded formulas in the rebuilt system
Real-time
Dashboard refresh replacing days of manual work
One truth
Finance, Ops & Country Leads aligned on same data

Approach

  • Discovery: mapped all 10 country models to identify shared vs. market-specific logic
  • Architecture: designed star-schema (fact + dimension tables) to handle multi-country complexity cleanly
  • Build: developed on Azure Databricks with parameterised assumption tables instead of hardcoded cells
  • Reporting layer: Power BI dashboards with cross-country and drill-down views
  • Governance: version control, documentation, and stakeholder training across 4+ country teams
Azure Databricks Power BI DAX & Power Query Star-Schema Modelling ETL Pipelines SQL 10 EU Markets Stakeholder Management
Power BI Board Reporting Finance & Ops

Finance & Ops Dashboards + Board-Level Investment Analysis

Client: SWARCO Smart Charging  ·  Role: BI & Analytics Specialist

SWARCO's Finance and Operations leadership needed visibility they couldn't get from their existing reports — scattered across systems, too slow to generate, and not designed for decision-making. On top of that, strategic investment decisions on EV charging infrastructure required a rigorous analytical framework that could survive board-level scrutiny. I was brought in to build both: the operational reporting layer and the investment analysis that went to the board.

The Problem

  • Finance & Ops reporting fragmented across multiple source systems
  • No self-service BI — leadership dependent on manual data pulls
  • Investment decisions made without a structured analytical framework
  • Board needed a clear, defensible view of infrastructure ROI

What I Built

  • Power BI dashboards for Finance leadership — P&L, cost tracking, KPIs
  • Operations dashboard — utilisation, deployment status, performance trends
  • Investment analysis model evaluating EV infrastructure opportunities
  • Board-ready outputs: scenario modelling, risk view, recommendation layer

Outcomes & Impact

Self-service
Leadership could answer their own data questions — no analyst dependency
Board
Investment analysis presented at board level and approved
Finance + Ops
Two functions aligned on one reporting layer for the first time
Defensible
Scenario & risk modelling held up under board-level challenge

Approach

  • Stakeholder discovery: workshops with Finance and Ops leads to map reporting needs and decision workflows
  • Data architecture: connected disparate source systems into a clean Power BI data model
  • Dashboard design: built for decision-making — not just data display. KPIs surfaced at the top, drill-through for detail
  • Investment model: structured ROI framework with scenario sensitivity analysis and risk flags
  • Board delivery: translated analytical findings into clear executive narrative with recommendation layer
Power BI DAX Power Query Financial Modelling Investment Analysis Scenario Modelling Board Reporting Stakeholder Engagement
Competitor Intelligence Strategy

10-Country CI System

Major European EV Infrastructure Operator
Built a structured competitor intelligence framework covering 10 EU markets — monitoring charging network growth, pricing strategies, and site expansion patterns. Enabled country teams and senior leadership to track competitive dynamics for the first time with a consistent, repeatable methodology.

Competitor Analysis Data Frameworks Power BI 10 EU Markets Strategic Reporting
Geospatial Analytics Site Evaluation

EV Site Profitability Model

E.ON Drive Infrastructure — Italy
Built a geospatial analytics framework to evaluate 890+ potential EV charging sites across Italy. The model scored sites on commercial viability, traffic, competition, and infrastructure factors — giving the business a defensible, data-driven methodology for site selection and investment prioritisation.

Geospatial Analysis Site Scoring Model Power BI 890+ Sites Investment Prioritisation

What I bring to a project

Technical depth. Business fluency. End-to-end delivery.

📊

BI & Dashboard Design

Power BI, Tableau, DAX and Power Query. I build dashboards for decision-makers, not data engineers — clear, fast, and built to last.

🏗️

Data Modelling & Architecture

Star-schema design, ETL pipelines, Azure Databricks. Systems that scale without needing constant maintenance or a team of engineers.

🔍

Business & Competitor Analysis

Frameworks for site profitability, market entry, and competitive intelligence. Turn raw data into strategic recommendations.

📈

Financial & Investment Analysis

ROI models, scenario analysis, and board-ready outputs. I translate numbers into the language of investment decisions.

🌍

Multi-country Programme Management

Managed 8+ countries simultaneously. 100% on-time delivery track record across 50+ EV deployment projects, with the stakeholder coordination that makes that possible.

🤝

Stakeholder & Exec Communication

Bridge builder between technical teams and business leadership. I present to boards and I can explain data to anyone.

🗺️

Process & Systems Modelling

BPMN 2.0 and UML in Enterprise Architect. AS-IS mapping, TO-BE design, and requirements with traceability — so a process map stops being a picture and becomes a specification a team can build from.

🎯

Agile Delivery & Governance

AgilePM® Practitioner. Epics and stories in Jira, requirements and decision logs in Confluence, sprint reviews that surface risk early. Structure where it earns its keep, not ceremony for its own sake.

Services

Project-based engagements designed to deliver fast, tangible outcomes.

BA Sprint
Fixed scope · 2–4 weeks

Rapid Business Analysis

Stuck on a business question you can't quite answer with your current data? I come in, map the problem, analyse what you have, and deliver a structured brief with findings and recommendations. Fast, focused, actionable.

Great for: Startups & scale-ups
Power BI Build
Fixed or time-bound · 3–6 weeks

BI Dashboard & Reporting

From messy data sources to clean, decision-ready dashboards your whole team can use. Includes data model design, dashboard build, and a handover session so you're not dependent on me to keep the lights on.

Great for: Finance, Ops, Exec teams
Automation Setup
Fixed scope · ~1 week

Workflow Automation

The repetitive work that eats your team's week — automated, tested, and documented. I connect your tools (CRM ↔ spreadsheets ↔ reporting) so they talk to each other, with AI handling the judgement calls. Built in Make — extending into custom Python pipelines when no-code hits its limits.

Great for: Lean teams & founders
AI-Assisted Dev
Scoped per project · days, not months

Custom Tools, Built with AI

Some problems are too custom for no-code and too small for a dev agency. I direct AI (Claude Code) to build working tools for your business — document-processing pipelines, internal apps, data cleaners. You bring the messy process; I ship the tool that eats it.

Great for: Custom internal tools
Fractional BI Lead
Ongoing · 1–3 days/week

Embedded Analytics Partner

For growing companies that need senior BI capability without the overhead of a full-time hire. I join your team part-time, own the analytics function, and help you build data habits that scale.

Great for: Series A/B energy & tech
Systems Analysis
Fixed scope · 3–6 weeks

Business & Systems Analysis

Before anyone writes code, someone has to say what the thing must actually do. I map how the work happens today in BPMN, model how the system needs to behave in UML, and write requirements traceable to a design, a backlog story and a test. Delivered in Enterprise Architect, Jira and Confluence — documentation your developers can build from and your auditors can follow.

Great for: Teams about to build something

Let's solve something together.

Available now for remote projects and roles across Europe and the wider EMEA region. If you have a data problem, a BI gap, or a business question that needs answering — let's talk.